Your AI Agent Is Stuck After a Rate Limit That Already Cleared
Your agent hit a usage limit, the limit reset hours ago, and it is still sitting blocked. Why the recovery path that already existed never ran, and how to check yours.

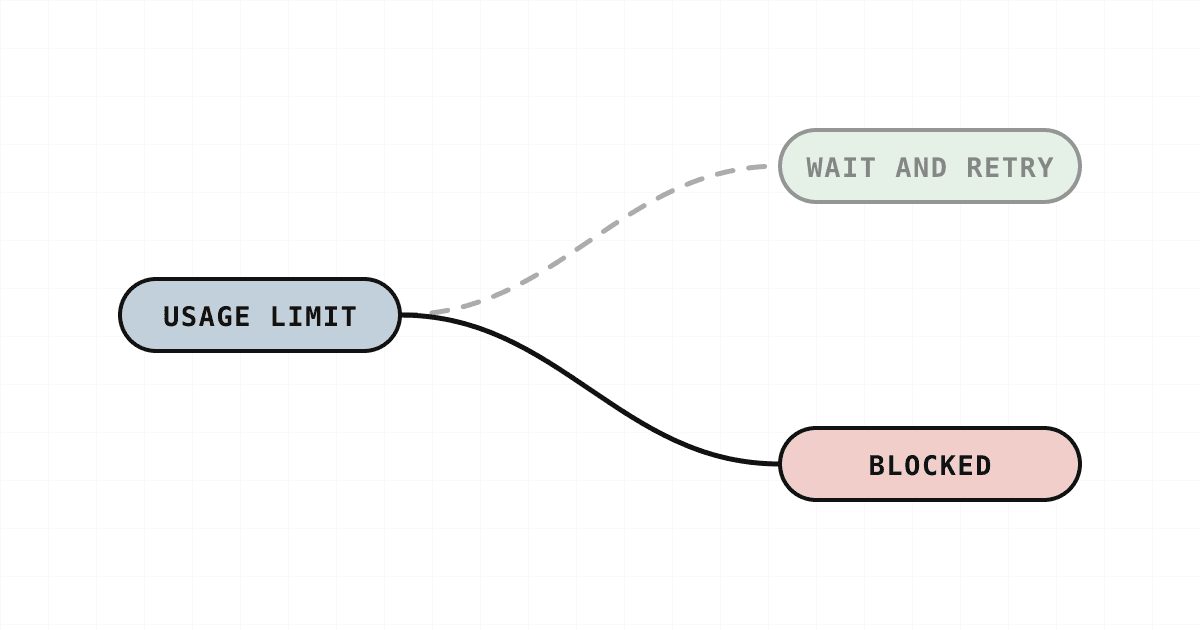
The queue has not moved since two in the morning. The agent hit a session limit, the limit reset at four, and at nine it is still sitting in a blocked state with a note attached saying a human needs to look at it. So you look at it. The provider is fine. The condition the agent failed on stopped being true five hours ago.
The interesting question is not why the agent hit a usage limit. Rate limits, session caps and weekly quotas are normal operating conditions for anything running against a provider at volume, and hitting one is not a defect. The question is why a condition that expires on its own became a state that does not.
One report, and what it says
Precision about the evidence first, because the argument does not need more than it has.
There is a reported and still-open issue in an open-source agent harness in which recovery logic classifies session and weekly limit failures as stuck work, and mints a permanent blocked record requiring manual intervention, instead of routing them to the provider quota wait that already exists in the same codebase.
That is one report. It is open. That tells you it is not fixed; it does not tell you anyone is working on it. It attaches to the build its reporter states rather than to how that software behaves today. And I am not going to tell you it is a pattern, because one report is not a pattern, and one report is what I have.
What earns it the page is its last clause. Not that the harness broke. That the correct handling path was already there in the same codebase, written and present, and the path that failed went around it.
The failures next to this one
Failures that look alike from the dashboard want different fixes.
If your agent stalls mid-task with no defined move, waiting on an input that never arrives or looping on the same call, the gap is a missing path, and that is what to do when your AI agent gets stuck.
If the work completed and the run reported failure anyway, nothing is broken except the measurement, and that is why agents get marked failed when they succeeded. Its mirror image, a run reporting success over work that never landed, is an agent saying done when it isn't.
This is a different one. The failure was real. The recovery for it was written. The failing path did not reach it. Nothing is missing, and nothing is mislabelled at the reporting layer. What came apart is the routing between an error and the handler that already existed for it.
A control that exists is not a control that binds
This next part is my argument rather than a measurement, and I would rather mark it as that than dress it up as a finding.
Finding a control in a codebase tells you it was written. It does not tell you which paths reach it. A retry policy binds on the call sites wired to it. A quota wait binds on the classifier branches that route to it. Every other failure site is a separate question with a separate answer, and that answer is not implied by the control existing somewhere in the repository.
The awkward part is that this gets worse as the machinery gets better. The more complete your recovery layer, the more confident everyone becomes that this class of thing is handled, and the fewer people go and check which branch a newly appearing error actually lands in. A default branch that converts an unrecognised provider error into a permanent local state is a decision. It is one that can get made without anyone deciding it.
The document that catches this, and the document that misses it
This is where the argument cashes out, so let me put the two artifacts side by side.
The first document lists what the system contains. Retry with backoff, present. Provider quota wait, present. Escalation on repeated failure, present. Under a document like that, the system in the report above is compliant. Every control it names is genuinely there, and anyone auditing can go and read the code that implements it. The document is accurate, and the queue still does not move on Monday.
The second document states what is genuinely enforced, and it is written per path rather than per feature. It reads: for the condition "the provider returns a usage limit," these are the code paths that can produce that condition, this is the control that must handle it, and here is the check showing that each of those paths reaches that control. It names the enforcement point rather than the feature.
The difference that matters is that only the second one can come back and tell you no. A control inventory has no failing state; everything in it is present by construction. A statement of what is enforced, checked against the paths that actually run, does have a failing state, and the failure it surfaces is exactly the one in the report: a control that is present and unreached. The layered version of the same discipline, applied to isolation, credentials and run attribution rather than to recovery, is the AI agent governance stack.
A check that reports clean is evidence only if it was capable of reporting otherwise. That test belongs on your own enforcement document, and on this page too.
What to check in your own system
None of this needs the report or the codebase behind it. It is four passes over your own.
- List the conditions that clear by themselves. Rate limits, session caps, weekly quotas, cooldowns, provider overload responses, billing states that lift on renewal. Each of these is a wait with a duration, not a failure with a cause.
- Write two lists per condition, not one. The control that is supposed to handle it, and every code path that can produce it. For the second list, start from how the condition arrives, the status code or the error type, and find every place your code raises, wraps or re-raises it, then follow each one to where it gets classified. The gap between the two lists is the finding: a path nobody thought of as a producer of that condition. Those two lists, done for a single condition, are the first page of a statement of what is genuinely enforced, and the reason to write it down instead of holding it in your head is that a written one can come back and tell you no.
- Read the classifier, not the handler. This class of failure is not always a broken wait. The wait can be fine and never get called, because the error was never labelled as the kind of thing the wait handles. Find the default branch, ask what it does with a provider error it does not recognise, and ask whether "unrecognised" quietly means "permanent."
- Hunt for failure records with no expiry. Any state your system can write that only a person can clear is a standing request for a person. If the underlying condition has a known reset time, the record about it should carry one, and the thing that clears it should be the clock rather than you.
Those four passes are only available to you if the harness, the classifier and the failure records sit on infrastructure you hold. Reading a default branch and a latched record is an afternoon's work when the code and the state are on a machine you can reach. It is not work you can do at all when the recovery logic is someone else's and the state is behind an API that hands you back a status string. On a hosted runtime you can file a report and wait for someone else's release. On your own, you can go and look.
The takeaway
An agent still blocked at nine over a limit that reset at four is not necessarily a system without recovery. It can be a system whose recovery was written, reviewed, believed, and never wired to the path that failed. A list of controls will not find that. A statement of what is genuinely enforced, checked path by path against the code that actually runs, will.
If you are auditing a runtime for this, that is what a working session is for. Bring the classifier and the list of conditions that clear by themselves, and we will find out which of them reach the control you believe handles them. Start there.

Why Paperclip vs Hermes Is the Wrong Question
Paperclip and Hermes sit at different levels of the stack: company orchestration versus agent runtime. Hermes now ships as a built-in Paperclip adapter. Here is what each platform actually gives you today, where the boundary sits, and what that means for an operator building on Paperclip.
How to Configure Execution Policies in Paperclip
An execution policy sits between an agent calling done and Paperclip recording done. Here's how to configure review and approval gates at the task level.
Paperclip Alternatives: Runtimes, Adapters & Native Skills
Paperclip alternatives compared by category, including native agent capabilities: skills, adapters, and runtime execution across the stack.